Process capability is a key concept in Quality and Continuous Improvement (CI). For people not familiar with the concept, process capability is a process’s ability to consistently produce product that meets the customer requirements.
Conceptually, process capability is simple. If a process makes products that meet the customer requirements all the time (i.e. 100%), it has a high process capability. If the process does it only 80% of the time, it is not very capable.
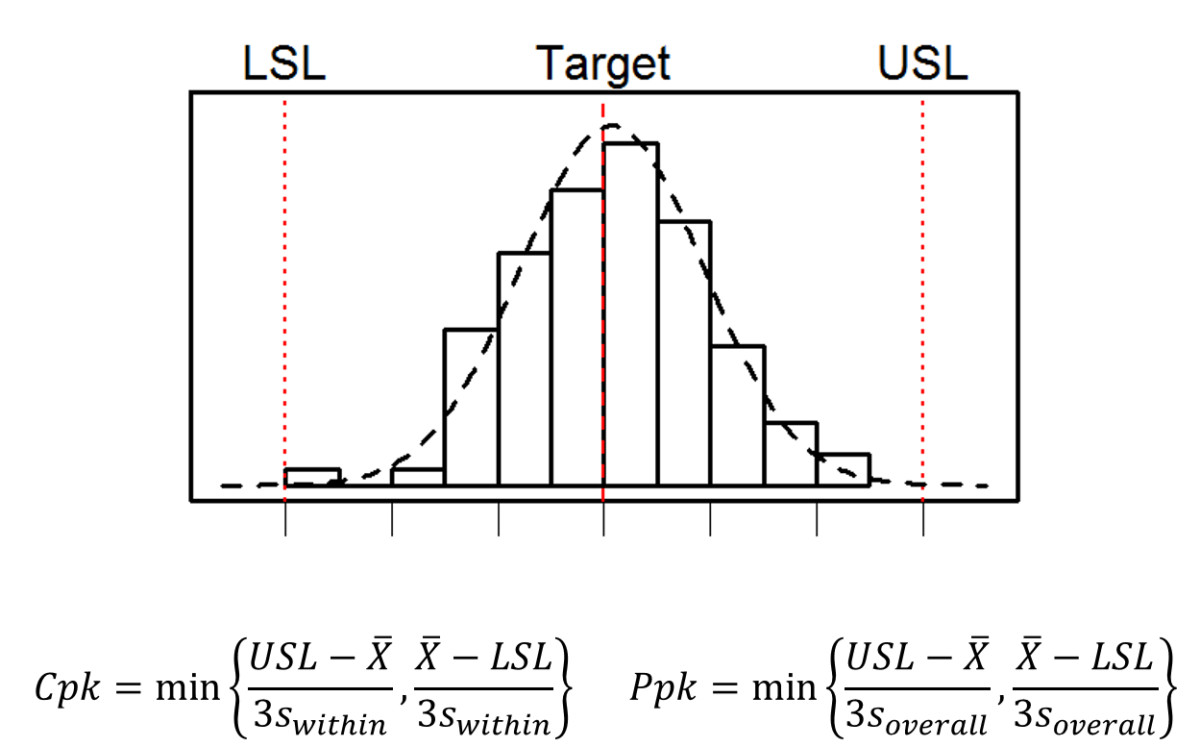
For quality attributes measured as continuous or variable data, many organizations use Process Capability Index (Cpk) or Process Performance Index (Ppk) as the metric for evaluation. In my consulting work, I often observe confusion and mistakes applying the concept and associated tools, even by Quality and CI professionals. For example,
- Mix-up of Cpk and Ppk
- Unclear whether or when process stability is a prerequisite
- Using the wrong data (sampling) or calculation
- Misinterpretation of process capability results
- Difficulty evaluating processes with non-normal data, discrete data, or binary outcomes
The root cause of this gap between this simple concept and its effective application in the real world, in my opinion, is lack of fundamental understanding of statistics by the practitioners.
Statistics
First, a process capability metric, such as Cpk, is a statistic (which is, by definition, simply a function of data). The function is typically given as a mathematical formula. For example, mean (or the arithmetic average) is a statistic and is the sum of all values divided by the number of values in the data set.
The confusion between Cpk and Ppk often comes from their apparently identical formulas, with the only difference being the standard deviation used. Cpk uses the within-subgroup variation, whereas Ppk uses the overall variation in the data. Which index should one use in each situation?
It is important to understand that any function of data can be a statistic – whether it has any useful meaning is a different thing. The formula itself of a statistic does not produce the meaning. Plugging whatever existing data into a formula rarely gives the answer we want.
To derive useful meaning from a statistic, we must first define our question or purpose and state assumptions and constraints. Then we can identify the best statistic, gather suitable data, calculate and interpret the result.
Enumerative and Analytic Studies
Enumerative and analytic studies1 have two distinct purposes.
- An enumerative (or descriptive) study is aimed to estimate some quantity in the population of interest, for example, how many defective parts are in this particular lot of product?
- An analytic (or comparative) study tries to understand the underlying cause-system or process that generates the result, for example, why does the process generate so many defective parts?
If the goal is to decide if a particular lot of product should be accepted or rejected based on the number of defective parts, then it is appropriate to conduct an enumerative study, e.g. estimating the proportion of defectives based on inspection of a sample from the lot. A relevant consideration is sample size vs. economic cost – more precise estimates require larger samples and therefore cost more. In fact, a 100% inspection will give us a definite answer. In this case, we are not concerned with why there are so many defectives, just how many.
If the goal is to determine if a process is able to produce a new lot of product at a specified quality level, it is an analytic problem because we first have to understand why (i.e. under what conditions) it produces more or fewer defectives. Methods used in enumerative studies are inadequate to answer this question even if we measured all parts produced so far. In contrast, control charts are a powerful analytic method that uses carefully designed samples (rational subgroups) over time to isolate the sources of variation in the process, i.e. understanding the underlying causes of the process outcome. This understanding allows us to determine if the process is capable or needs improvement.
Cpk versus Ppk
If our goal is to understand the performance of the process in a specific period (i.e. an enumerative study), we are only concerned with the products already made, not the inherent, potential capability of the process to produce quality products in the future. In this case, demonstration of process stability (by using control charts) is not required, and Ppk using a standard deviation that represents the overall variability from the period is appropriate.
If our goal is to plan for production, which involves estimating product quality in future lots, the process capability analysis is an analytic study. Because we cannot predict what a process will produce with confidence if it is not stable, demonstration of process stability is required before estimating process capability.
If the process is stable, there is no difference between within-subgroup variation (which is used for Cpk) and overall variation (which is used for Ppk), except estimation errors. Therefore, Cpk and Ppk are equivalent.
If the process is not stable, the overall standard deviation is greater than the within-subgroup variation — Ppk is less than Cpk as expected. However, Ppk is not a reliable measure of future performance because an unstable process is unpredictable. If (a big IF) the subgroup is properly designed, the within-subgroup variation is stable and Cpk can be interpreted as the potential process capability if all special causes are eliminated. In practice, the subgroup is often not designed or specified thoughtfully, making interpreting Cpk difficult.
In summary, process capability analysis requires good understanding of statistical concepts and clearly defined goals. Interested practitioners should peruse many books and articles on this topic. I hope the brief discussion here helps clarify some concepts.
1. Deming included a chapter “Distinction between Enumerative and Analytic Studies” in his book Some Theory of Sampling (1950).
Comments
2 responses to “Understanding Process Capability”
[…] Not all bad practices are as easily detectable as p-hacking. They often use statistical concepts and tools for the wrong question. One category of such examples is failing to differentiate enumerative and analytic problems, a concept that Deming wrote extensively in his work, including the article mentioned above. I also touched on this in my blog Understanding Process Capability. […]
[…] people who use performance metrics or statistics. I discussed some specific mistakes in using process capability indices last July. A more general problem is that statistics can hide the information we need to […]