Tag: statistical process control
-
Improving Change Detection
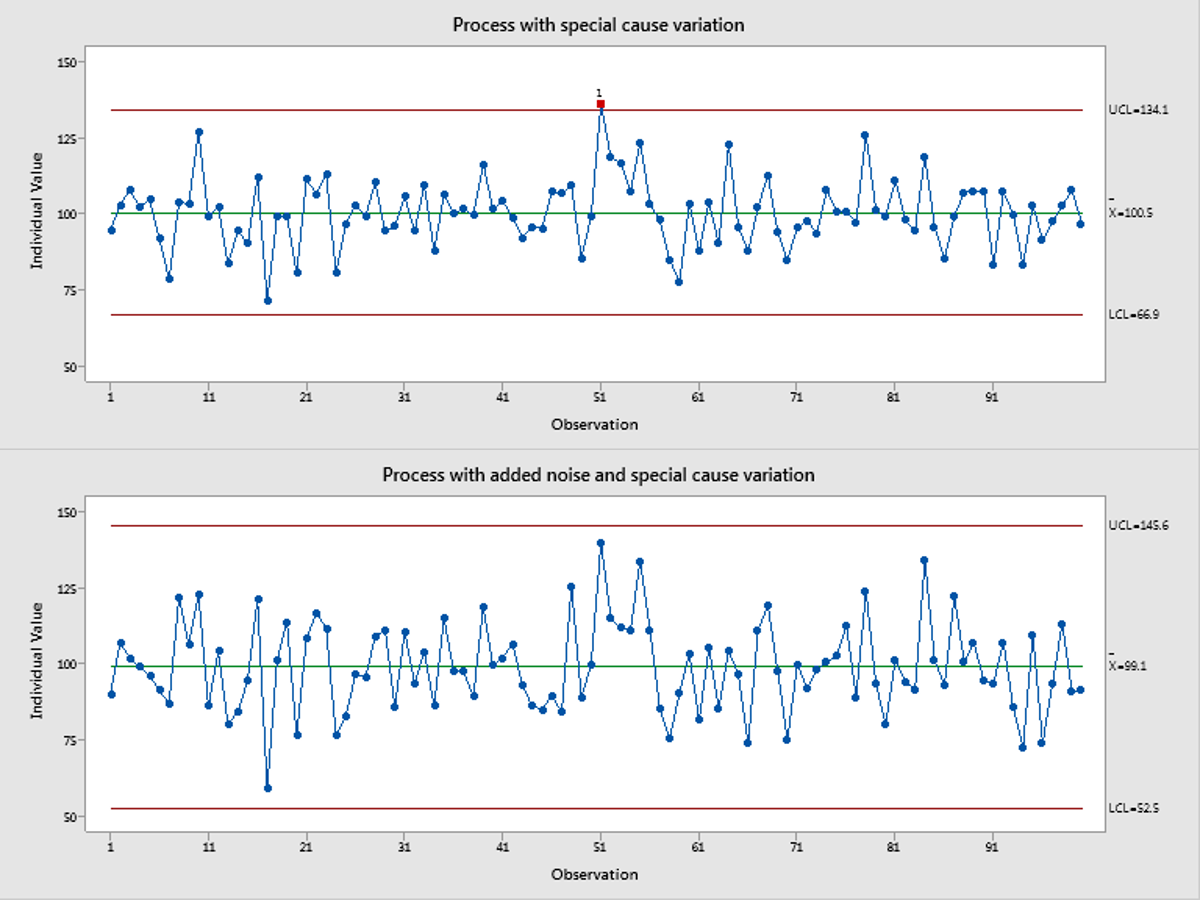
Change detection in time-related data is a common application of statistical methods. For example, we may want to detect if the consumer preferences have changed over time, if a piece of equipment has deteriorated and requires maintenance, or if a manufacturing process has drifted, increasing risk of producing defects. In my teaching, consulting, and general…
-
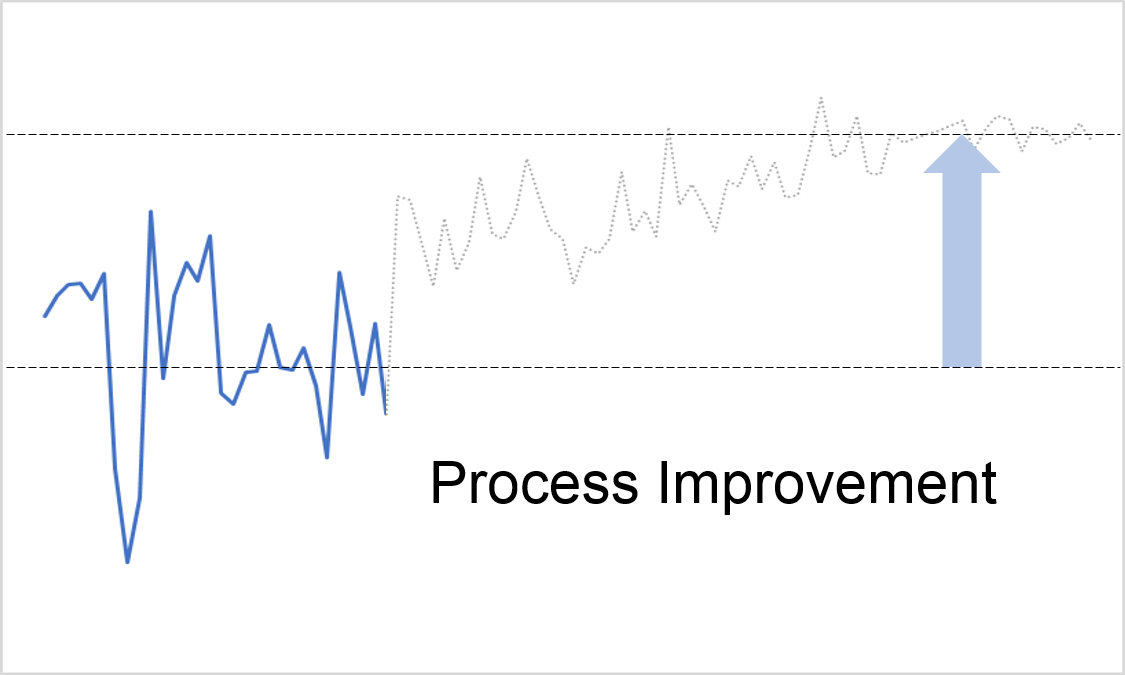
Achieving Improvement
In my blog Setting SMART Goals, I made the point that having a measurable goal in an improvement project is not enough — we have to know how it is measured and interpreted to make it useful. What makes a goal achievable? In my work as a Continuous Improvement (CI) coach and consultant, I have…
-
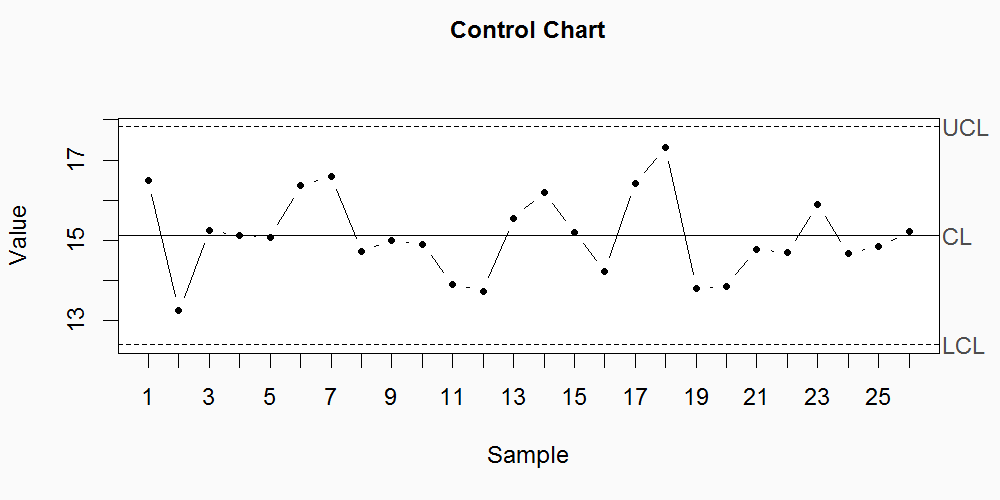
Is Your Process in Control?
In 1980, the American Society for Quality (ASQ) republished Walter Shewhart’s seminal book Economic Control of Quality of Manufactured Product as a 50th anniversary edition. In his Dedication to this commemorative issue, W. Edwards Deming wrote: “There was never before greater need for statistical methods in industry and in research.” I’d say the same today,…