Change detection in time-related data is a common application of statistical methods. For example, we may want to detect if the consumer preferences have changed over time, if a piece of equipment has deteriorated and requires maintenance, or if a manufacturing process has drifted, increasing risk of producing defects.
In my teaching, consulting, and general discussion with students and practitioners, I have noticed that many people are eager to learn the mechanics of different tools, e.g. how to choose a specific type of process control chart or how to determine the right parameters for cumulative sum (CUSUM), so they can get the job done. But few ask the question: “what makes the tool effective in the real world?”
In the case of a control chart, a crucial condition that makes the control chart effective is process standardization.
Continuous Improvement (CI) professionals know that standardized work is a fundamental principle of the Toyota Production System (TPS) or Lean. Standardization minimizes process variation, which enables greater sensitivity in detecting special cause variation by the control chart.
Many people don’t realize that even if a control chart shows no special cause variation, it does not mean that the process is in statistical control. In many cases, such as processes that lack standardization, there are simply too many uncontrolled variables present and they become part of the process. But these variables are not inherent to the process and inflate the common cause variation.
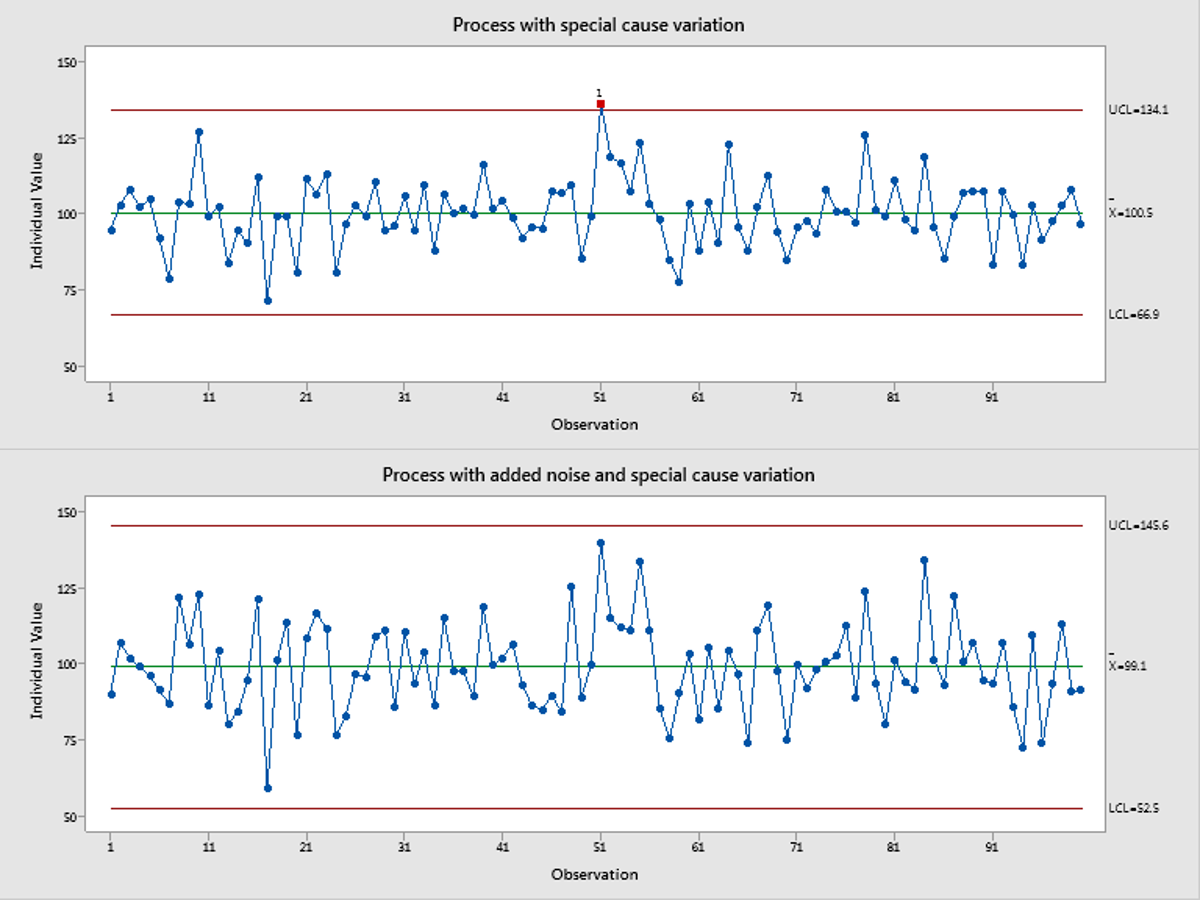
The accompanying figure shows a hypothetical example. The top chart shows a stable process, except that points 51 to 55 have a positive deviation of 20. The individuals chart (or I-chart) detects the change. The bottom chart is the same process with the same positive deviation for points 51 to 55, but some random deviations (or noise) are added. The control limits are more spread out, and the special cause variation is not detected.
Additional noise reduces the ability of a control chart to detect change.
In my observation of real processes, many contain both special cause variation and the additional noise illustrated above. So naturally, the CI professionals tend to focus on reducing the special cause to bring the process back in control. However, with the persisting noise the process never reaches its true state of control.
The additional noise can come from many sources. A major source is lack of standardization.
In a regular production environment, operating procedures have room for interpretation and thus can lead to process variation. In my experience in R&D and manufacturing, many people honestly believe that they follow the same procedure each time. But upon careful investigation, deviations are common.
Those familiar with gage repeatability & reproducibility (R&R) studies appreciate the potential for human errors or deviations. Using a well-established measurement procedure, the same operator can still have varying results measuring the same items (i.e. repeatability error). Different operators likely introduce additional variability (i.e. reproducibility error). In a less standardized process, there are many more opportunities for deviation.
The effectiveness of standardization to reduce noise is limited by our understanding of the design space and critical process variables. Because many processes are not well studied and designed using Quality by Design (QbD) principles, some residual noise will likely remain after standardization.
In summary, if you want to improve change detection, make sure that you identify the sources of the extra noise in the process and operationally control them.