Shortly after I wrote my last blog “On Statistics as a Method of Problem Solving,” I received the latest issue of Quality Progress, the official publication by the American Society for Quality. A Statistics article “Making the Cut – Critical values for Pareto comparisons remove statistical subjectivity” caught my attention because Pareto analysis is one of my favorite tools in continuous improvement.
It was written by two professors “with more than 70 years of combined experience in the quality arena and the use of Pareto charts in various disciplines” and covers a brief history of Pareto analysis and its use in quality to differentiate the vital few causes from the trivial many.
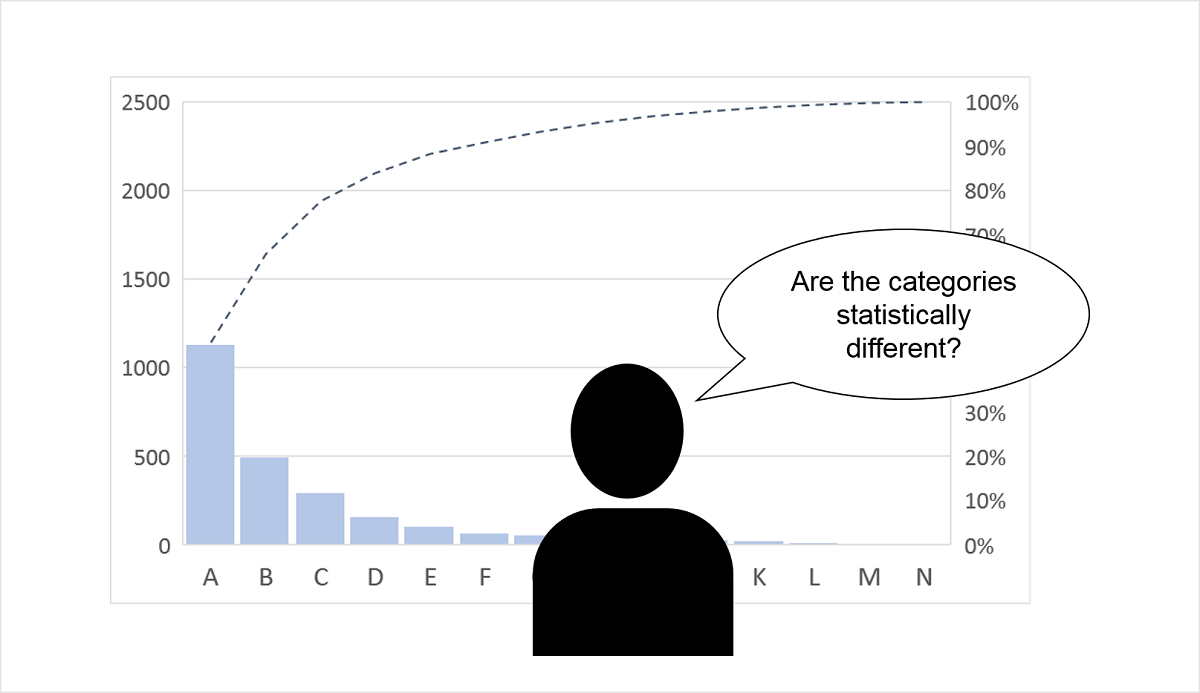
The authors introduced a statistical method to address the issue of “practitioners who collect data, construct a Pareto chart and subjectively identify the vital few categories on which to focus.” The main point is that two adjacent categories sorted by occurrence in a descending order may not be statistically different in terms of their underlying frequency (e.g. rate of failure) due to sampling error.
Based on hypothesis testing, the method includes two simple tools:
- Critical values below which the lower occurrence category is deemed significantly different from the higher one
- A p-value for each pair of occurrence observations of the adjacent categories to measure the significance in the difference
With a real data set (published by different authors) as an example, they showed that only some adjacent categories are significantly different and therefore, are candidates for making the cut.
I see the value in raising the awareness of statistical thinking in decision making (which is desperately needed in science and industry). However, in practice, the method is far less useful than it appears and can lead to improper applications of statistical methods.
Here are but a few reasons.
- The purpose of Pareto charts is for exploratory analysis, not for binary decision-making, i.e. making the cut which categories belong to the vital few. As a data visualization tool, a Pareto chart shows, overall, whether there is a Pareto effect – an obvious 80/20 distribution in the data not only indicates an opportunity to apply the Pareto principle but also gives the insight in the nature of the underlying cause system.
- Using the hypothesis test to answer an unnecessary question is waste. Overall, if the Pareto effect is strong, the decision is obvious, and the hypothesis test to distinguish between categories is not needed. If the overall effect is not strong enough to make the obvious decision, the categorization method used is not effective in prioritization, and therefore, other approaches should be considered.
- Prioritization decisions depend on resources and other considerations, not category occurrence ranking alone. This is true even if the Pareto effect is strong. People making prioritization decisions based solely on Pareto analysis are making a management mistake that cannot be overcome by statistical methods.
- The result of the hypothesis test offers no incremental value – it does not change the decisions made without such tests. For example, if the fourth ranking category is found not statistically different from the third and there are only enough resources to work on three categories, what should the decision be? How would the hypothesis test improve our decision? Equally unhelpful, a test result of significant difference merely confirms our decision.
- The claim of “removing subjectivity” by using the hypothesis test is misleading. The decision in any hypothesis test depends on the risk tolerance of the decision maker, i.e. the alpha (or significance level) used to make the decision whether a given p-value is significant is chosen subjectively. The choice of a categorization method also depends on subject matter expertise – another subjective factor. For example, two categories could have been defined as one. In addition, many decisions in a statistical analysis involve some degrees of expert judgment and therefore introduce subjectivity. Such decisions may include whether the data is a probability sample, whether the data can be modeled as binomial, whether the process that generated the data was stable, etc.
Without sufficient understanding of statistical theory and practical knowledge in its applications, one can easily be overwhelmed by statistical methods presented by the “experts.” Before considering a statistical method, ask the question “how much can it practically improve my decision?” In addition, “One must never forget the importance of subject matter.” (Deming)