It’s March 31, 2020. In the past 3 months, the novel coronavirus (COVID-19) has changed the world we live in. As the virus spreads around the globe, everyone is anxiously watching the latest statistics on confirmed cases and deaths attributed to the disease in various regions. With the latest technology, timely data is more accessible to the public than ever before.
With the availability of data comes the challenge of proper comprehension and communication of it. I am not talking about advanced data analytics or visualization but communication and interpretation of simple numbers, counts, ratios, and percentages.
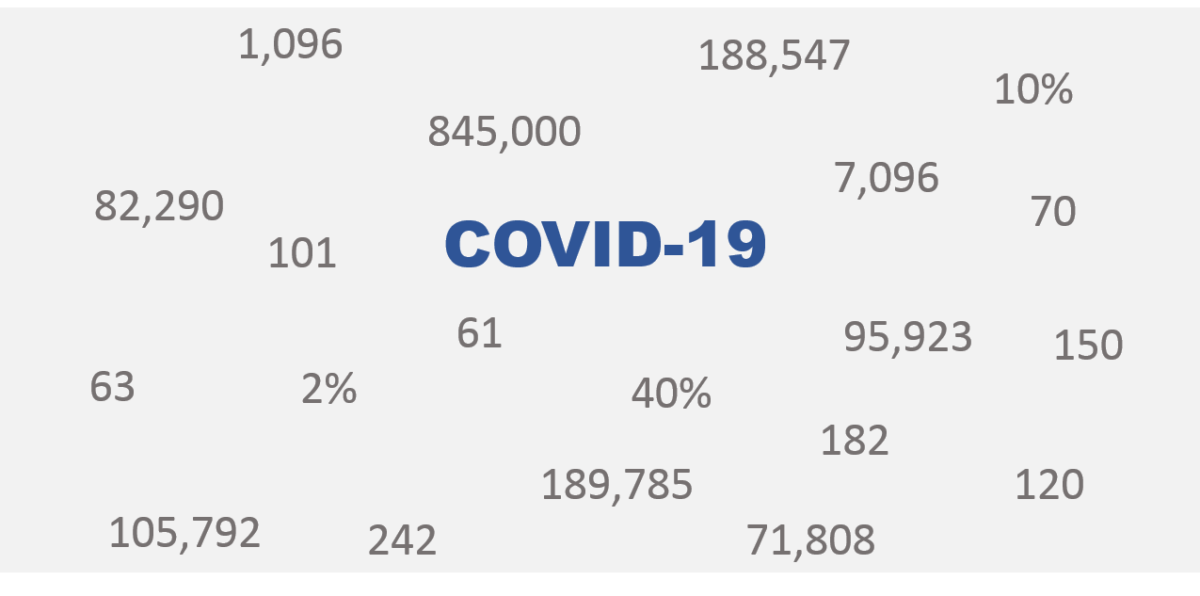
The COVID-19 pandemic has provided us ample examples of such data. If not careful, even simple data can be misinterpreted and lead to incorrect conclusions or actions.
Cumulative counts (or totals) never go down. They are monotonously increasing. The total confirmed cases always increase over time even when the daily new cases are dropping. The total is not most effective in communicating trends, unless we compare it with some established models. The change in daily cases can give a better insight of the progress.
Even the daily change should be interpreted with caution. A jump or drop in new cases on any single day may not mean much because of chance variation inherent in data collection. It is more reliable to fit the data to a model over a number of days to understand the trend.
The range of a dataset gets bigger as more data is collected. Even extreme values that occur infrequently will show up if the sample size is large. Younger people are less likely to have severe symptoms if infected by the virus. The initial data on hospitalization or mortality show predominantly older patients, the most vulnerable population. As more cases are collected, the patient age range will naturally expand to include very young patients who need hospitalization or even die. But this increase in the number of younger patients does not necessarily mean that the virus has become deadlier for the younger population.
The percentage of hospitalized patients who are under 65 years of age is by itself not a right measure of the disease risk to the younger population. There are significantly more people younger than 65 than those older in a general population. Each person’s risk should be adjusted by the size of the age group. In addition, the severity of each hospitalized patient is different and their pre-existing health conditions also play a critical role in their recovery or survival.
Mortality is the ratio of the number of the deceased to the number of confirmed cases. The numerator is likely more accurate than the denominator. It is likely most patients who died of COVID-19 related complications are counted, whereas the confirmed cases represent mainly those infected people who have severe symptoms, which is known to be the minority. Therefore, the calculated mortality is likely an overestimate at the initial stage of the pandemic when the prevalence of the disease is uncertain.
In the above examples, it only takes some awareness to avoid data misinterpretation. For critical decisions, we must understand the context of the data, e.g. where the data came from, what data is collected, how it is collected, what data is missing, etc.
We should never forget that the data we often see is collected from a sample of the population we try to understand. Any statistic (or calculation) from the sample data, such as count or average, is not of most interest. What we truly want to know is some population attribute estimated based on the sample data. We cannot measure the entire population, e.g. test everyone to see who are infected, and have to rely on sample data available to us. Different samples can give drastically different data. We must understand what that sample is and how it is selected in order to infer from the data.
For example, the sample may not be representative of the population. The people who have been tested for the new coronavirus represent a sample. But if only seriously ill people are tested, they do not represent the general population if we want to understand how deadly the virus is.
Equally important is the method of measurement. All tests have errors. An infected person could give a negative test result (i.e. a false negative), and an uninfected person could give a positive result (i.e. false positive). The probabilities of such errors depend on the test. Different tests on the same people can give different results.
To analyze data properly, trained professionals depend on probability theory and sophisticated methods. For most people, though, it helps to know that what’s not in the data could be more important than the data.